
Just last week, it happened that I was sitting at home in front of my laptop with a glass of red wine in my hand when I noted the Department of Immigration and Border Protection had released their latest visa statistics on international students.
This sounds a tad depressing in retrospect, but the mood did strike. I decided to boot up my trusty excel models to quickly cut up some of the statistics to see what insights might be developed from the visa numbers.
Given that international student visa grant rates have a strong correlation with international student commencements, these figures are a good proxy measurement for future international student demand.
While I don’t usually delve too deep into the visa data every single month, March is usually a pretty important month in international education, particularly in higher education, as generally most new international student cohorts have commenced for the first half of the year.
While I still await the Department of Education data on commencements and enrolments) (which should arrive any day or week now), what follows is a slice and dice of some interesting metrics giving an idea of how the entire industry (and its sub-sectors) are faring in terms of visa grant rates. But first, some assumptions!
Data assumptions
- I’ve only examined primary visa applicants.
- In most cases, I’ve also set the ‘month’ filter to ‘March’, so I can compare year on year data to get an idea of how the visa grant rates have changed over time.
- In certain cases, I’ve also limited data to the last five periods, covering July to March of each relevant financial year (DIBP generally publish visa grant data in terms of financial years). In others, I’ve simply looked at the last two financial years: 2015 /16 and 2016/17 only covering the visa grant data between July and March of these periods.
- I look at cumulative visa grants from July to March of each period, rather than visa grants in a month.
Of course, the full data sets are available online and for free at the below website:
That data set does have its own usage guidelines which may be of interest.
Too long; Didn’t read? Here’s the take away headlines
- International student visa grants are up 14% year on year as at March 2017.
- International students being granted visas are primarily looking to enroll in higher education, which has about 53% of the market. VET and ELICOS have increased their proportions of all visa grants by 0.5 percentage points each, indicating increasing popularity.
- China and India have continue to dominate student visa grant recipients. Source countries like Brazil and Nepal have made surprisingly good year on year gains.
- Queensland has performed well in the latest data, with 18% year on year growth in applicant grant rates. New South Wales continues as the most popular institution destination of all students granted a visa in 2016/17 with approximately 37.7% of the market.
- Not a huge amount of change in the proportion of onshore/offshore international student visa grant recipients, with tow thirds being offshore in 2016/17.
Read on for a bit further details and some explanatory charts.
How is 2017 shaping up in terms of international student visa grants?
Figure 1 below shows a year on year and month by month comparison of the number of student visas granted by DIBP to primary visa holders. And as you can see, it’s looking pretty good for the 2016/2017 financial year.
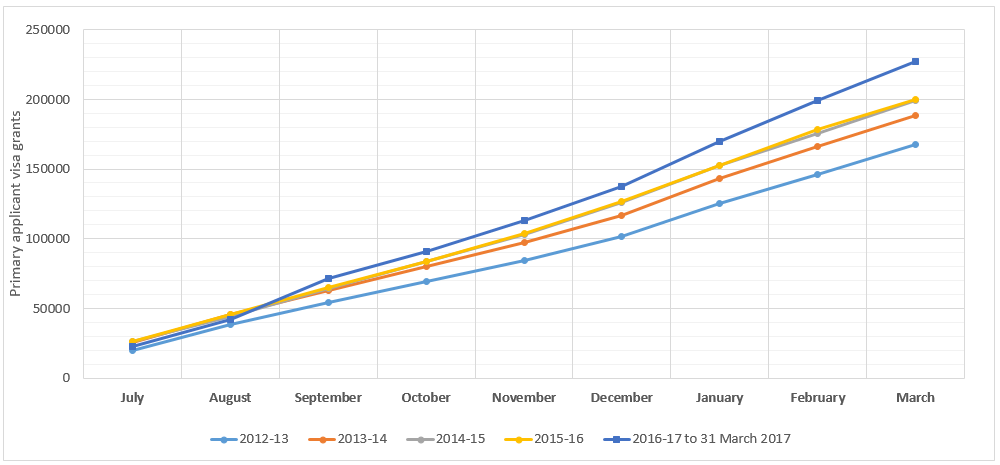
- We can see that in the period 2016-March 2017, cumulative international student visa grant rates are 14% up from at the same time last year. Since 2012/2013, cumulative visa grant rates to international students has grown on average 8% per reporting period.
- On the basis of above, we could reasonably conclude that, on a whole, visa grant data indicates continued growth for international higher education in Australia throughout 2017.
A glance at industry sub-sectors
Figure 2 below shows the breakdown of cumulative visa grants at March of the relevant period. The percentage indicates the share of the total industry each sector occupies for the particular period (for example, higher education attracted 53.1% of all visa grants to international students in total for the period 2016-2017 (July to March).
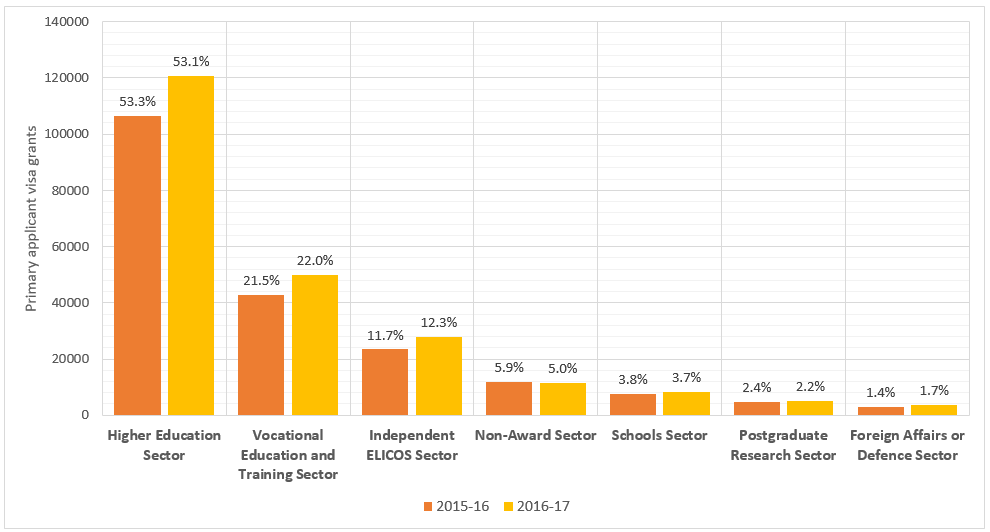
- As at March 31 2017, more than 50% of all visas granted during 2016/2017 period have been for higher education. This proportion has remained relatively unchanged compared to 2015/16, with a slight change of 0.2 percentage points.
- The chart shows a slight bump of 0.5% percentage for the VET sector, whereas a healthy bump for ELICOS of half a percent also. Non-award is less popular compared to last financial year, dropping 0.9% percentage points.
- We can also see from the height of the bars that Higher Ed, VET and ELICOS have all seen promising increases in total cumulative visa grants in the 2016 to March 2017 period.
Where are the students generally from?
Figure 3 below shows the top five nationalities across all sectors of student visa grants for primary applicants. Year on year change is indicated as a percentage.
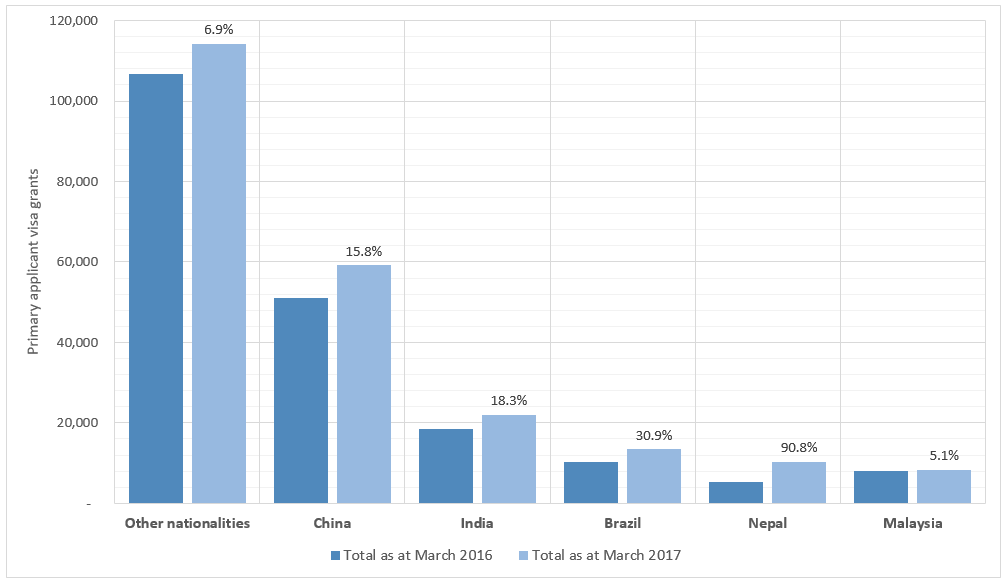
- Analysis of the top five source nationalities for international student visa grants from July 2016 to March 2017 reveals a familiar story: China once again dominates visa grants. As at March 2017, primary applicant student visa grants for China were 59,121, an almost 16% growth compared to March 2016.
- India provided the second highest source of visa grants with 21,856 (+18.3%) across all sectors.
- Considering the recent fate of the Brazilian Science without Borders scheme, it was somewhat surprising to see Brazil’s not only retain but increase its total number of visa grants year on year, with growth at almost 31% year on year. The primary reason for this is due to seemingly increasing demand from Brazil for VET and ELICOS student visas.
- Nepalese student visa grants grew a staggering 90.8% year on year to 10,265 student visa granted between July and March of the current financial year. This was due to strong demand for higher education visas, which grew 76% year on year to 8,245 visas granted financial year to date.
Where the students are likely headed to?
Figure 4 below shows the aggregate data on the likely institution location of the student visa recipient. This is broken up by Australia State/Territory.
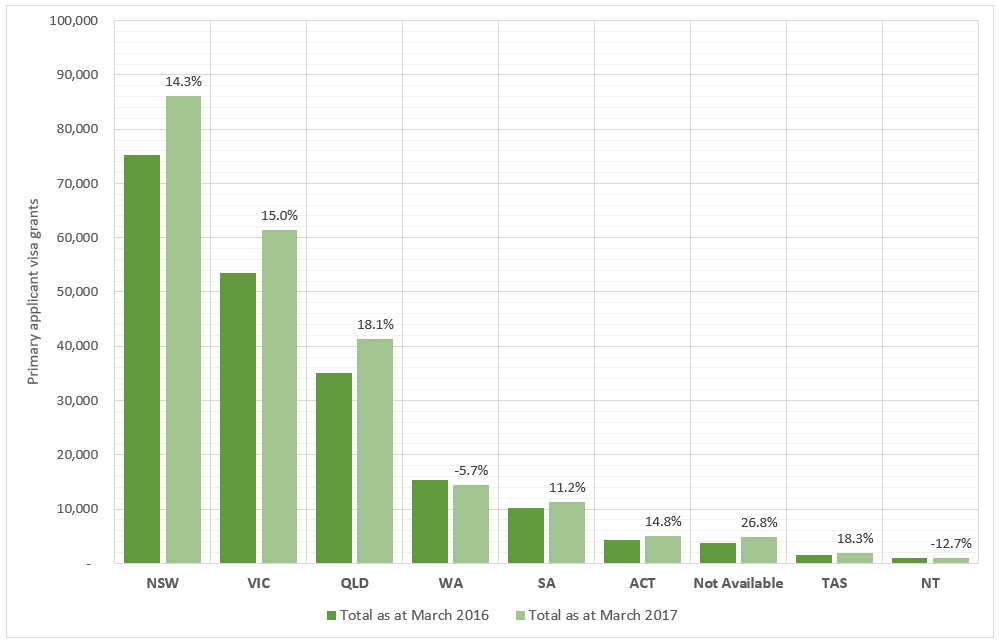
- The visa grants data has some good news for Queensland, who showed the sharpest year on year growth at 18.1% between March 2016 and March 2017. Queensland improved its proportion of visas grants from 17.5% to 18.2% – a difference of 0.7% – between March 2016 and March 2017, the best of any state or territory during this financial year.
- New South Wales continues to attract the largest proportion of international student visas grant recipients with approximately 37.7% of all international student visas granted in the current financial year nominating to study in New South Wales .Victoria follows behind with roughly 27.1%.
- Western Australia visa grant rate dropped 5.7% year on year, its proportion of all visa grants falling from 7.7% to 6.4%.
- Note large proportion of ‘not available’ visa grants, which may alter the above chart and analysis further down the line.
Are those who are being granted visas already here in Australia?
And finally, figure 5 below shows the location of the applicant when the visa application was made, giving us an idea of the relative importance of onshore and offshore recruitment in international education.
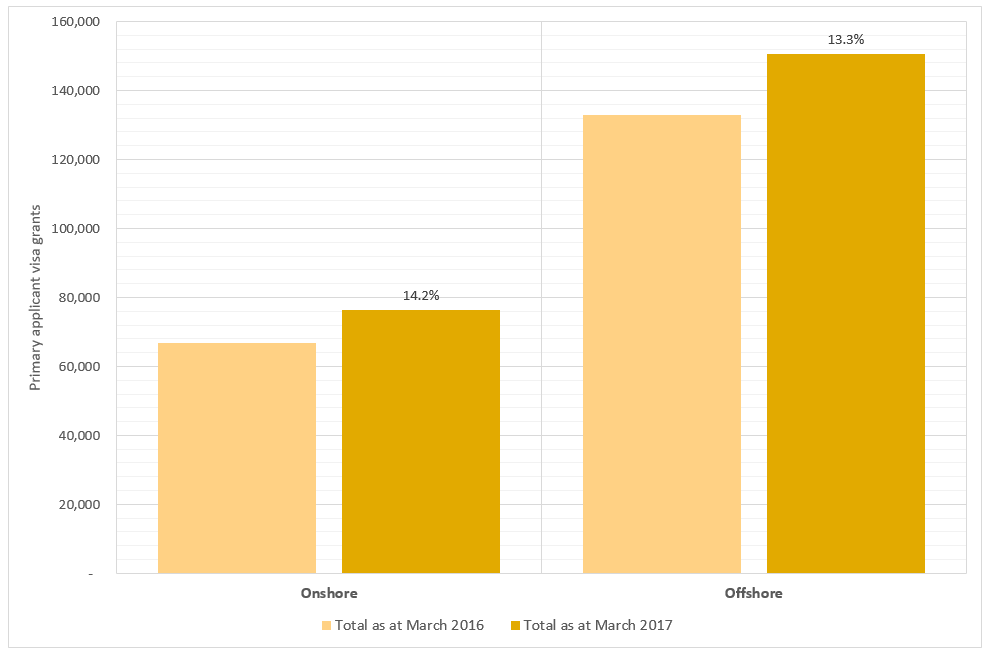
- There hasn’t been much change in the proportion of onshore versus offshore applicants between 2015/16 and 2016/17, with more or less two thirds of all applicants being offshore students.
- In total 76,446 applicants were onshore when they applied for their international student visa versus 150,649 offshore.
- Saying that onshore applicant volume grew 14.2% versus offshore 13.3%
And that’s it…
There is plenty more one is able to do with these data sets, and heaps of value at looking into nationality level data by sector to get an idea of the changing demands for Australian education throughout the world. I would fully expect this data to indicate healthy overall commencement numbers in the Department of Educaiton (“DET”) March census data.
Get in touch
As I said a the top, I was having a glass of wine when putting these together (one glass only), so if you spot an error or have a question, feel free to drop me a line, via LinkedIn or Twitter or simply by commenting here.
Leave a Reply
You must be logged in to post a comment.